Page 8 - annual_report_2024
P. 8

6                                                                      CA Sri Lanka  Integrated Annual Report 2024


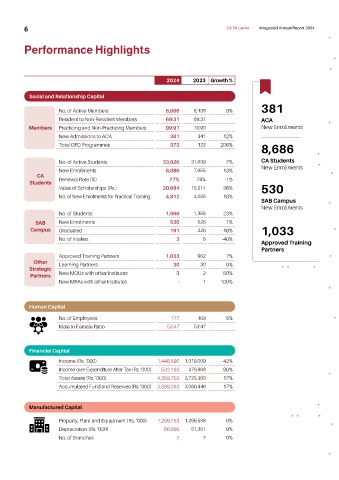
          Performance Highlights


                                                            2024     2023 Growth %

           Social and Relationship Capital
                                                                                             381
                      No. of Active Members                6,666     6,136      9%
                      Resident to Non-Resident Members       69:31    69:31                  ACA
           Members    Practicing and Non-Practicing Members    09:91    10:90                New Enrollments
                      New Admissions to ACA                  381      341      12%
                      Total CPD Programmes                   373      122     206%           8,686

                      No. of Active Students              33,926    31,639      7%           CA Students
                                                                                             New Enrollments
                      New Enrollments                      8,686     7,655     13%
              CA
           Students   Renewal Rate (%)                       77%      78%       -1%
                      Value of Scholarships (Rs.)         20,684    15,214     36%           530
                      No. of New Enrolments for Practical Training   4,812   4,086  18%
                                                                                             SAB Campus
                                                                                             New Enrollments
                      No. of Students                       1,666    1,358     23%
             SAB      New Enrolments                         530      525       1%
            Campus    Graduated                              191      228      -16%          1,033
                      No. of Intakes                           3        5      -40%
                                                                                             Approved Training
                                                                                             Partners
                      Approved Training Partners            1,033     962       7%
             Other    Learning Partners                       30       30       0%
           Strategic
            Partners  New MOUs with other Institutes           3        2      50%
                      New MRAs with other Institutes            -       1     -100%


           Human Capital
                      No. of Employees                       177      169       5%
                      Male to Female Ratio                   53:47    53:47


           Financial Capital
                      Income (Rs. ‘000)                 1,446,590  1,018,009   42%
                      Income over Expenditure After Tax (Rs. ‘000)   532,193   279,866  90%
                      Total Assets (Rs. ‘000)           4,359,702  3,725,360   17%
                      Accumulated Fund and Reserves (Rs. ‘000)  3,589,293  3,060,446  17%


           Manufactured Capital

                      Property, Plant and Equipment (Rs. ‘000)  1,299,753  1,299,598  0%
                      Depreciation (Rs. ‘000)              66,890   61,301      9%
                      No. of Branches                          7        7       0%
   3   4   5   6   7   8   9   10   11   12   13