
Page 143 - annual_report_2024
P. 143
CA Sri Lanka Integrated Annual Report 2024 141
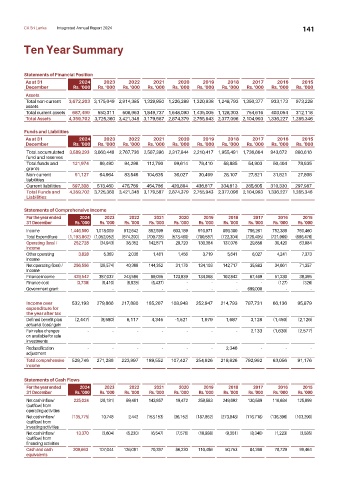
Ten Year Summary
Statements of Financial Position
As at 31 2024 2023 2022 2021 2020 2019 2018 2017 2016 2015
December Rs. ‘000 Rs. ‘000 Rs. ‘000 Rs. ‘000 Rs. ‘000 Rs. ‘000 Rs. ‘000 Rs. ‘000 Rs. ‘000 Rs. ‘000
Assets
Total non-current 3,672,203 3,175,049 2,914,385 1,329,850 1,226,289 1,320,938 1,248,793 1,350,377 933,173 973,228
assets
Total current assets 687,499 550,311 506,963 1,849,737 1,648,090 1,435,005 1,128,303 754,616 403,054 312,118
Total Assets 4,359,702 3,725,360 3,421,348 3,179,587 2,874,379 2,755,943 2,377,096 2,104,993 1,336,227 1,285,346
Funds and Liabilities
As at 31 2024 2023 2022 2021 2020 2019 2018 2017 2016 2015
December Rs. ‘000 Rs. ‘000 Rs. ‘000 Rs. ‘000 Rs. ‘000 Rs. ‘000 Rs. ‘000 Rs. ‘000 Rs. ‘000 Rs. ‘000
Total accumulated 3,589,293 3,060,446 2,767,736 2,507,396 2,317,844 2,210,417 1,955,491 1,736,664 943,672 880,616
fund and reserves
Total funds and 121,974 86,490 94,298 112,790 99,614 78,410 58,885 54,903 50,404 78,935
grants
Non-current 51,127 64,964 83,545 104,635 36,027 30,499 28,107 27,821 31,821 27,808
liabilities
Current liabilities 597,308 513,460 475,769 454,766 420,894 436,617 334,613 285,605 310,330 297,987
Total Funds and 4,359,702 3,725,360 3,421,348 3,179,587 2,874,379 2,755,943 2,377,096 2,104,993 1,336,227 1,285,346
Liabilities
Statements of Comprehensive Income
For the year ended 2024 2023 2022 2021 2020 2019 2018 2017 2016 2015
31 December Rs. ‘000 Rs. ‘000 Rs. ‘000 Rs. ‘000 Rs. ‘000 Rs. ‘000 Rs. ‘000 Rs. ‘000 Rs. ‘000 Rs. ‘000
Income 1,446,590 1,018,009 912,642 852,599 603,189 910,971 859,380 756,261 752,389 760,460
Total Expenditure (1,193,862) (1,052,952) (874,290) (709,728) (573,469) (780,587) (722,304) (726,405) (721,969) (696,476)
Operating (loss) / 252,728 (34,943) 38,352 142,871 29,720 130,384 137,076 29,856 30,420 63,984
income
Other operating 3,828 5,369 2,036 1,481 1,456 3,719 5,641 6,027 4,241 7,373
income
Net operating (loss) / 256,556 (29,574) 40,388 144,352 31,176 134,103 142,717 35,883 34,661 71,357
income
Finance income 429,542 387,032 243,586 89,095 123,839 134,068 102,842 67,469 51,230 38,395
Finance cost (3,738) (5,410) (8,528) (5,437) - - - - (127) (326)
Government grant - - - - - - 699,000 - -
Income over 532,193 279,866 217,880 185,207 108,948 252,947 214,793 787,731 66,136 95,879
expenditure for
the year after tax
Defined benefit plan (2,447) (8,580) 6,117 4,345 -1,521 1,979 1,687 3,128 (1,450) (2,126)
actuarial (loss)/ gain
Fair value changes - - - - - - - 2,133 (1,630) (2,577)
on available for sale
investments
Reclassification - - - - - - 2,346 - - -
adjustment
Total comprehensive 529,746 271,286 223,997 189,552 107,427 254,926 218,826 792,992 63,056 91,176
income
Statements of Cash Flows
For the year ended 2024 2023 2022 2021 2020 2019 2018 2017 2016 2015
31 December Rs. ‘000 Rs. ‘000 Rs. ‘000 Rs. ‘000 Rs. ‘000 Rs. ‘000 Rs. ‘000 Rs. ‘000 Rs. ‘000 Rs. ‘000
Net cash inflow/ 225,024 (26,181) 59,481 143,857 19,472 258,583 249,692 130,589 116,684 125,099
(outflow) from
operating activities
Net cash inflow/ (135,775) 10,748 2,442 (153,153) (36,152) (187,862) (273,848) (116,718) (136,396) (103,290)
(outflow) from
investing activities
Net cash inflow/ 13,370 (3,604) (6,230) (6,547) (7,576) (10,988) (9,351) (8,340) (1,223) (3,585)
(outflow) from
financing activities
Cash and cash 209,663 107,044 126,081 70,387 86,230 110,486 50,753 84,260 78,729 99,464
equivalents